 Job Seekers
 Resources
 Timesheets
 Submit a CV
 Login
Login Temporary Staffing Solutions
 Permanent Recruitment Solutions
 Executive Search
 Payroll Services
 Modular Recruitment Services
 Employer Resources
 HR Services
 WHS Consulting
 Outplacement / Career Transition
 Accounting and Finance
 Business Support
 Community Services
 Customer Service
 Engineering
 Events and Exhibitions
 Government
 Healthcare
 Labour Hire
 Manufacturing
 Not-for-profit
 Sales and Marketing
 Warehousing and Logistics
 About us
 Meet the Team
 Blog
Blog Community
 Candidate Timesheet
and Portal Information
Candidate Timesheet
and Portal Information Blog
Blog Join the Team
 Payroll Services
 Timesheets
 Customer Service
 Engineering
 Warehousing & Logistics
7 Key Findings: Australian Workers’ Compensation Statistics

Safe Work Australia recently released a report on “Australian Workers’ Compensation Statistics” for the period between 2000-01 & 2015-16.
The statistics in the report are of Australian workers’ compensation claims that were lodged over the 15-year period between 2000–01 and 2015–16 and are an indicator of Australia’s work health and safety performance, however this data does not cover all cases of work-related injuries and diseases.
The statistics are presented by:
- sex
- age group
- occupation
- industry
- nature of injury or disease
- mechanism of injury or disease
- breakdown agency of injury or disease, and
bodily location of injury or disease
For the purposes of the report, only serious claims are considered.
A serious claim is an accepted workers’ compensation claim for an incapacity that results in a total absence from work of one working week or more. Claims in receipt of common-law payments are also included. Claims arising from a journey to or from work or during a recess period are not compensable in all jurisdictions and are excluded. Serious claims also exclude compensated fatalities.

Key findings
1) The median time lost for serious claims increased by 33% from 4.2 working weeks to 5.6 per claim.
2) The median compensation paid for serious claims increased by 30% from $5200 to $6800 per claim.
3) There were 104,770 serious claims compensated for the period 2015-16 with the three occupations with the greatest number of claims being;
- Labourers
- Machinery Operators and Drivers
- Community and Personal Service Workers
4) The three industries with the highest rate of serious claims were;
- Agriculture, forestry and fishing
- Manufacturing
- Construction
5) When considering gender, the frequency rate of serious claims per million hours worked for the period 2015-16 was 6.2 for men and 4.9 for women. The causes of serious claims for the same period represent an overwhelming percentage of 90% due to injury and musculoskeletal disorders.
- Older males (45+) are by far the highest risk for serious claims in terms of incidents and frequency, particularly if they work in either the Manufacturing or Construction sectors.
- Over the period from 2000-01 to 2014–15, the number of serious claims have decreased by 22 per cent for male employees and 6 per cent for female employees. Frequency rates have fallen over the same period, 30 per cent for females and 39 per cent for males.

6) The number of serious workers’ compensation claims decreased in six of the nine major occupation groups.
- The largest percentage decrease occurred among Labourers (down 30 per cent) and Clerical & Administrative workers (down 29 per cent).
- The largest increase occurred among the Community and personal service workers group (25 per cent increase).
- All occupations have recorded a fall in both frequency and incidence rates over the period.
7) From 2000-01 to 2014-15, the number of serious claims decreased in 13 of the 17 industry divisions.
- The largest decrease occurred among employees in the Information, Media and Telecommunications industry (down 51 per cent), the Manufacturing industry (down 48 per cent) and the Financial and insurance services industry (down 39 per cent).
Horner Recruitment, as a supplier to your industry sector, recognises this risk and takes the following measures to protect both you and our workers from any potential incidents. Click on the picture below to watch an example of this in practice:
(WorkSafe Award Winner – HORNER – Leading Return to Work Practice by an Employer)
For those interested in the full stat breakdown of the Safework Australia Compensation statistics, please follow the link below:
If you have any questions about workplace safety, please contact us to find out more.
Thanks,
The HORNER team
Related blog posts
View all posts
2025 SEEK Annual Recruitment Awards (SARAs) Finalist!
Horner is a SEEK Annual Recruitment Awards (SARAs) finalist! We’re thrilled and proud to share t...
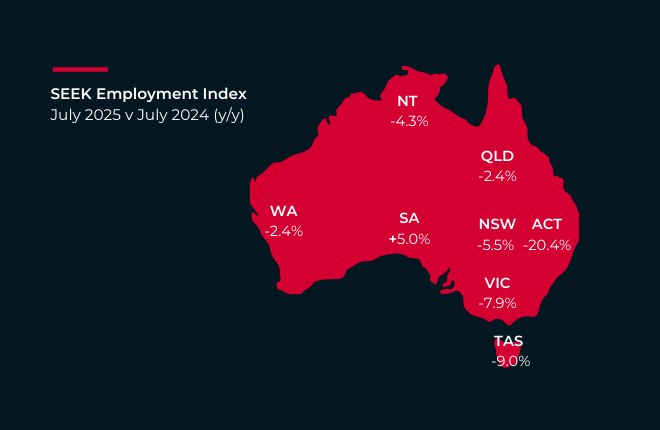
Employment Trends – July 2025
Snapshot of the latest employment trends for July 2025: The unemployment rate remains steady at 4.2%...

2025 Recruitment & Staffing Industry Census
Your voice is important – have your say in the 2025 Recruitment & Staffing Industry Census...